Bow-Tie diagrams are a very useful way to visualise the components of security risks and a fantastic way to understand the relative importance of different controls and mitigations.
A bow-tie diagram uses the risk scenario under consideration as the ‘knot’ of the tie with two trees either side, the left-hand tree is a fault tree showing the causal relationships that cause the risk and the right-hand tree is an event tree showing the consequences of the risk.
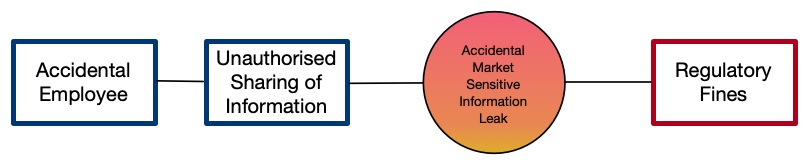
A very simple bow-tie is as follows; a threat source, the risk event they cause, the risk scenario this creates and then the consequence that results:
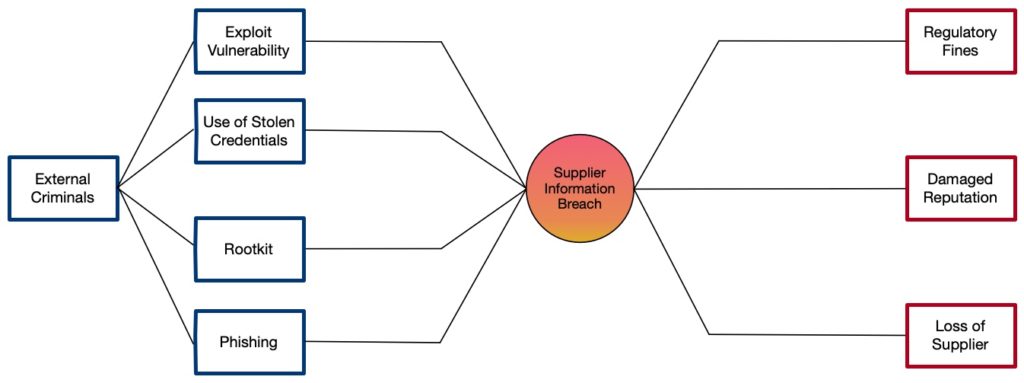
This is much simpler than most bow-tie diagrams, a more complicated example includes the following that shows many events and consequences:
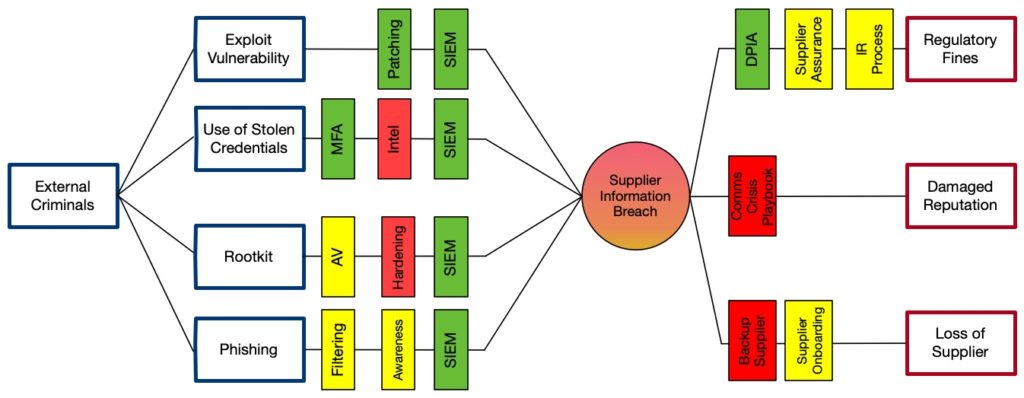
The real value of a bow-tie diagram is in evaluating the available controls and mitigations. In this context, a control is a limiting factor that influences the fault tree on the left-hand side whereas, a mitigation is a limiting factor that influences the event tree on the right-hand side. The diagram below shows some example controls in place:
A bow-tie can be extended with concepts of frequency/likelihood, control/mitigation effectiveness and quantified consequences. This can provide a simple view of which controls or mitigations are more useful and if you are judging effectiveness and coverage whether or not your controls and mitigations provide any real defence or just a sense that you mostly comply with a control framework.
Given their simplicity and effectiveness, I am surprised that we haven’t seen greater adoption of Bow-Tie diagrams to formalise the presentation of cybersecurity risk and control assessments.
NOTE: I’ve added a little more explanation in a follow up post following some questions from peers.
1 thought on “Dressing up security with Bow-Ties”
Comments are closed.